
Please see footnote Nr. 1
Volatility is to financial markets what the “Force” is to the world of Star Wars films. An invisible matter that permeates everything and connects everyone and everything2. For a long time, the concept of volatility was understood from a risk management perspective as the retrospective standard deviation σ\sigmaσ of asset returns. In contrast, tradable volatility as a financial product with its own second- and third-order derivatives is based on the market’s expected risk. Thus, volatility has evolved from a measure of market price risk to a measure of the market price of risk.
Volatility and Stocks
Who isn’t familiar with the images of volatility shooting upward during market turmoil? The negative correlation between volatility and stocks, however, exists at all times. This dependency, known in the Anglo-Saxon world as “The Devil’s Correlation,” is illustrated in the following figures:
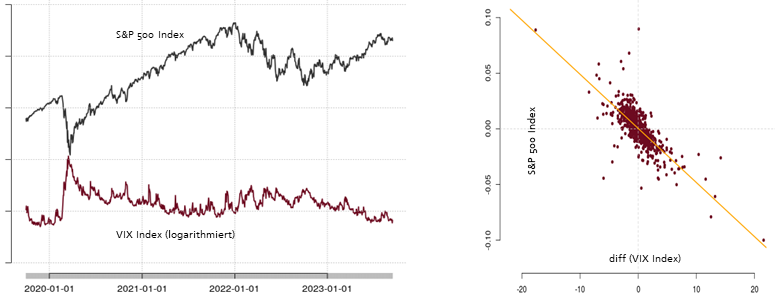
To the left, the performance of the S&P 500 Index and the logarithmic development of the Volatility Index VIX from January 2020 to July 2023 are juxtaposed. The axis symmetry is immediately apparent. A regression of the two variables over the same period also shows a strong dependency, with a coefficient of determination R2=0.826R^2 = 0.826R2=0.826. In fact, the observation period does not matter; the R2R^2R2 always lies between 0.8 and 0.9.
However, no statement can be made about the cause-and-effect direction of the Devil’s Correlation. In volatility, there is no correct or incorrect cause-and-effect relationship. Rather, various markets are kept in balance by volatility as a connecting element.
For example, by purchasing a stock, an investor expresses their hope for rising prices and thus falling volatility. With the selection of strike and expiration dates, options traders bet on the volatility necessary for the hoped-for movement of the underlying asset, while the counterparty typically opens a similar position for hedging purposes. FX, bond, interest rate, or real estate markets also show, besides market-specific influencing factors, a dependency on volatility.
Consequently, all financial market transactions can be reduced to a supply or demand for volatility. Following economic laws, volatility thus establishes itself as an equilibrium price.
If one understands the dependence of volatility on supply and demand as well as the Devil’s Correlation axiomatically, it follows that every financial market transaction must affect the level of volatility, and thus also the price formation in all other financial markets. This is the decisive, cross-market, and connecting character of volatility.
Opportunities and Risks of Volatility Derivatives
The business with volatility derivatives, especially options, often serves to hedge securities portfolios. Due to the inverse correlation between volatility and market price, a hedging position can be built with corresponding call options on volatility.
These calls act like insurance against falling stock prices. The buyer becomes the policyholder, and the seller becomes the insurance company (IC). The payout profiles are also similar to those of a line of business in an IC: market situations with exceptionally high volatility are relatively rare, like property damage. Most of the time, the calls on volatility expire worthless, and the insurer earns the premium. However, this is where the similarity with the insurance business ends. A key difference is that in an insurance contract, insured persons or objects are precisely named. This is not possible with options on volatility. In the case of property insurance, for example, the IC steps in when one of the insured houses has burned down. In contrast, with volatility calls, all insured objects metaphorically catch fire simultaneously.
For a policyholder, hedging with options on volatility is interesting because of the potential payout profiles. For example, on Friday, February 21, 2020, just before the Corona Crash, the VIX was at 16.7 points, and the S&P 500 at 3,330 points. The market crashed the following Monday, February 24, 2020, by about 3.5% and lost about 27% of its value in the two weeks leading up to March 12, 2020 (and had not yet reached its low point). The VIX Index stood at 25 points on that Monday, February 24, 2020, rising by 60% in one trading day. On March 12, 2020, the index was at 76 points, another jump of over 200%. If one had bought just ten call options with a strike at 23 points at the beginning of 2020, at a price of about €1.50 each, the initial €1,500 investment would have turned into €60,000 in two weeks—a return of about 40,000%.
Such market situations are rare. Nevertheless, many investors have aimed not only to hedge expected losses with volatility options in such cases but also to maintain a chance of additional returns. Thus, in 2021, hedging was partially shifted to volatility in many places.
However, in 2022, many painfully realized that when the markets fell again by about 30%, hedging with volatility did not work this time.
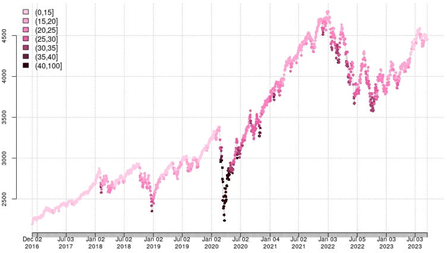
The image above illustrates the reason for this: It shows the performance of the S&P 500 Index, with each day color-coded according to the level of the VIX. Although the market fell only slightly more sharply during the acute Corona crisis in February and March 2020 than later from January 2022 to October 2022, the Volatility Index VIX temporarily reached 60-70 points in 2020, while in 2022, it rarely rose above 30 points. The market decline in 2022 occurred so gradually that volatility was able to recover between phases of falling prices, meaning that the starting point for volatility was again at a low level for the next downtrend.
This is probably one of the most significant disadvantages of hedging with volatility derivatives: Volatility does not depend on the absolute level of the market but is shaped by the relative change in the market per unit of time.
This property is also reflected in the delta and gamma of volatility options. The delta, i.e., the change in the option price per change in the underlying (volatility), is currently around 0.2 for options that are about 10 points out of the money. At the money, the delta is about 0.8 and asymptotically approaches 1 in the money. So far, so normal.
However, the gamma, which expresses the rate of change of delta, is sometimes 100 times higher for volatility options than for options in other asset classes. This is likely due to the relatively small “normal” range for volatility, which usually moves between 13 and 26 points but often makes larger jumps within this range. Volatility options can move deep in the money and out of the money within a short period.
This gamma has some implications, especially for sellers of call options. Typically, option writers or market makers will hedge the short-volatility position created by selling call options and aim to be market-neutral again.
For the hedging described above, such as a long-stock position, the demanded volatility options are usually initially out of the money. The market maker will, therefore, initially hedge only a small part of the options volume derived from the current option delta.
When volatility rises, three things can work against them:
- With rising volatility, the market maker will adjust their hedge ratio and coverage. But because more or less everyone reacts simultaneously in this situation, there is a sudden surge in demand for volatility.
- Due to the relative connection between volatility and other markets, market-neutral cross-hedge approaches with other asset classes and systemic damping effects are complex. Today, volatility derivatives are almost always hedged with other volatility derivatives, mostly futures. However, this can bring the liquidity in the entire volatility market to its knees.
- The exponential nature of gamma, whereby the volume of hedges increases more and more with rising volatility, further accelerates the rise in volatility in such a market situation.
Due to these three factors, the risk of a positive, self-reinforcing feedback loop increases massively. As soon as the execution of hedging transactions causes volatility to rise, triggering hedging mechanisms again, volatility and the derivatives associated with it spiral out of control. This scenario is also known as a gamma squeeze.
Volmageddon
A gamma squeeze occurs more often than one might think. Fortunately, many are less dramatic than anticipated.
An example of a dramatic gamma squeeze, even with a temporarily high systemic risk, was the so-called Volmageddon (sometimes also called Volapocalypse). On February 5, 2018, the VIX Index jumped from 17 to briefly 92 points within just 15 minutes for no apparent reason and later closed at 37 points, still 117% above the previous day’s close. Simultaneously, the rise in volatility caused the American stock indices Dow Jones to drop by 7% and the S&P 500 by 6%.
A Credit Suisse ETN with the symbol XIV and an investment volume of approximately $1.9 billion is considered primarily responsible for this3, the world’s largest investment vehicle with a short-volatility strategy at that time. The XIV earned money by collecting option premiums from selling calls on volatility. In the event of rising volatility, losses were hedged by buying future contracts on the VIX. In the previous year, 2017, the XIV achieved a staggering return of over 200% due to continuously low volatility, which of course, also massively increased its volume.
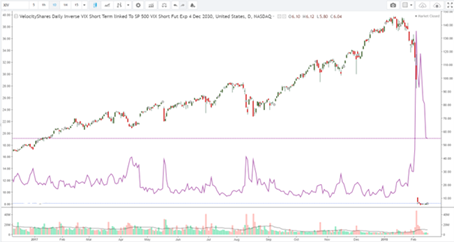
After two already difficult days for the XIV, the ETN was wiped out within less than an hour by a gamma squeeze on February 5, 2018. According to CS, the XIV’s hedging algorithm initially triggered smaller adjustments. The adverse dynamics unfolded when other market participants also reacted. There were massive purchases of future contracts on volatility, further fueling volatility. Within just a few minutes, the XIV’s algorithms detected additional hedging needs and again initiated the purchase of futures. Ultimately, Credit Suisse liquidated the ETN.
The gamma squeeze also had a significant impact on the broader market. The Dow Jones and the S&P 500 recorded the highest intraday losses in recent history, both before and after February 5, 2018. Although these indices stabilized again, it remains unclear whether the Volmageddon could have had a worse outcome for other volatility derivatives and the market.
Conclusion
From a crisis management perspective, the financial markets can be divided into two groups: markets with a singular nature, such as equities or bonds, and markets with a systemic nature, such as volatility. As long as volatility is traded as a derivative of one or more primary markets, there are few concerns. The highly specific characteristics of volatility options are known, understood, and usually mitigated by market makers. The characteristics of gamma are also understood and, if possible, proactively managed.
The situation becomes more problematic when the role of volatility is misunderstood as a market balancer or when too many products from other market segments (such as bonds, interest rates, or even real estate) are hedged using volatility. The probability of a positive feedback loop increases and, with it, the risk of a gamma squeeze.
1 On Monday, August 5, 2024, the Japanese market fell by more than 10%. This also led to losses in Europe and the USA, although far less pronounced than in the Japanese Nikkei Index. However, the VIX recorded its historically largest increase on that day, rising from below 20 to over 70 points at times. European and American brokers and asset managers, including BlackRock and Vanguard, immediately reported problems executing trades for retail clients. This suggests that panic selling by retail clients, especially ETF sales, needed to be prevented in this manner, particularly because the escalating volatility posed risks to the financial system (see Gamma Squeeze). In light of these events, we have now also published the somewhat older article on the subject in English.
2 With this definition of a universally connecting volatility, the increasingly common opinion is likely reflected that all consolidations, corrections, or crash situations in the stock market equally stem from an initial volatility shock. This, in turn, is caused by an external catalyst. For example, the Corona crash in 2020 would have been a result of a volatility shock triggered by concerns over a pandemic and simultaneously falling oil prices.
3 It must be added that investigations by financial regulators later revealed that Credit Suisse might have benefited significantly from the collapse of XIV, which is why the accusation of deliberately exploiting the gamma squeeze is still being addressed by courts. Regardless, the example serves well to illustrate the scale of the chain reaction and the speed at which such a squeeze unfolds.