

In 2001, Warren Buffett described the ratio of U.S. stock market capitalization to U.S. economic output as “the best single measure of where valuations stand at any given moment.” The indicator provides a relatively simple assessment of market valuation and is now known as the Buffett Indicator. It’s based on the macroeconomic thesis that over the long term, the ratio of GDP to market capitalization remains stable within an economy — making over- or undervaluation of that stock market visible.
While heavily simplified and often criticized, we still find it worthwhile to occasionally revisit the Buffett Indicator. The following charts depict the classic version for the U.S. market from 1975 to 2021 and supplement it with a global perspective.
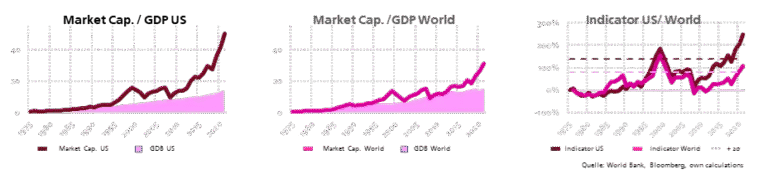
If colloquially we speak of “corona weight gain” — a few extra kilos due to lack of exercise, home office, and closed gyms — then the development of the Buffett Indicator must be considered particularly unhealthy, even obese. In the U.S., it has reached a record 250% of GDP — a level never seen before — exceeding the historical average by 3.6 standard deviations, far beyond the two deviations often considered the final warning sign. On a global level, market capitalization exceeds economic output twofold and sits in a similarly critical range at 2.4σ.
What’s particularly unsettling is that — despite all the simplifications and justified criticisms of the metric — the ratio has in past crises (as can be clearly seen for the dot-com bubble and the global financial crisis in the graphs) corrected back toward the long-term economic average.
To illustrate: if such a correction were to occur at today’s valuation levels, this would mean a drop in the S&P 500 from around 4,500 to 1,300 points — a crash. Translated to the DAX, that would be a fall from roughly 15,900 to about 4,450 points. A correction reflecting the global indicator’s excess would be less extreme, but still alarming: the S&P 500 would fall to around 2,100, and the DAX to 7,500.
Although the warning signs of a market bubble are hard to miss — as obvious as a sledgehammer — no one can say when a correction will actually happen. As Keynes already noted: “Markets can remain irrational longer than you can remain solvent.”
Applying a market psychology model inspired by economist Hyman Minsky might help assess how acute the current overvaluation really is.
According to the model, bubbles require an abnormal and prolonged market distortion — creating high liquidity and easy market entry. Following a decade of cheap central bank money and negative interest rates, COVID-related stimulus packages added further liquidity estimated at 10% of global GDP — or an astounding $9 trillion. At that point, the debate ends.
The excess capital seeks attractive or alternative investment opportunities — often with higher risk tolerance. Prices begin to rise in certain markets, slowly but steadily. This upward trend attracts further investors, accelerating growth. Eventually, this creates a group psychology effect known as FOMO — Fear of Missing Out. The fear of being left out pours even more money into the bubble, especially from less-experienced investors.
By that point, the second phase — euphoria — is already underway. Although some investors may become skeptical of the unnatural growth, they continue to believe that more buyers will come along to drive prices higher. In English, this is known as the Greater Fool Theory — the belief that someone even more reckless will still jump in. This can go on for quite a while, amplifying the euphoric mood and further inflating the price spiral.
When overvaluation becomes obvious to most market participants but prices keep rising — in line with the motto “dance while the music is playing” — this marks the start of the third and final phase. During this period, “smart money” begins quietly exiting the market. At the same time, central banks realize that striking a balance between avoiding further overheating and signaling confidence to the market is essentially impossible. When this sense of helplessness begins to show in public communication, it is a clear sign that the third phase has begun.
As with any chain reaction, it only takes a small and seemingly insignificant event to trigger mass panic among investors and burst the bubble.
To us, the evidence is clear: Based on the historical pattern of major global crises being preceded by a bursting bubble in late summer, we expect corrections to begin by the end of 2021. Accordingly, we have positioned our clients’ portfolios — and our own strategic market portfolio — to be weatherproof.